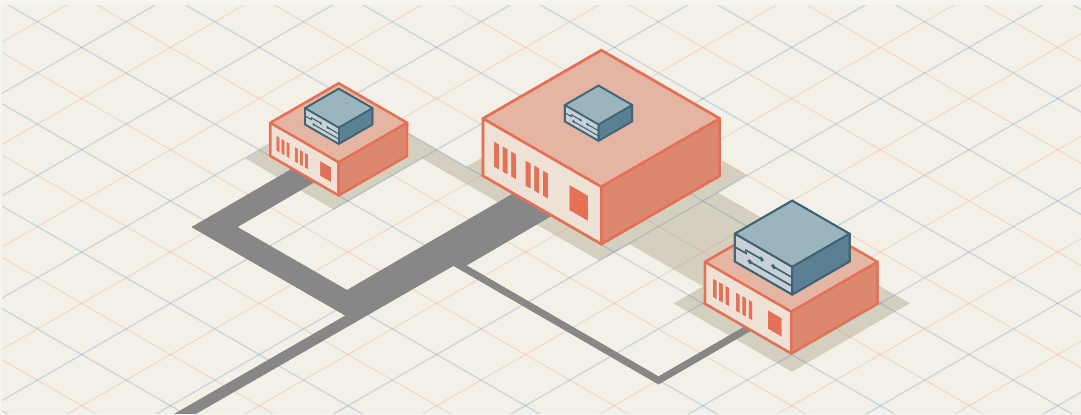
Physical Internet is not something on the cloud, but rather a structure made of physical objects: routers, cables, antennas, internet exchange points and data centers are just some of the elements that make this communication possible. The visualization focuses on showing the physical structure and the actual number of three main objects: data centers, where data is organized and stored; internet exchange points, that allow different service providers to exchange internet traffic; and, submarine cables, that carry telecommunication signals across oceans and seas. By looking at the visualization, one can easily see the difference between the countries who are connected and the ones which are being left out. For example, the United States of America have the greatest number of internet exchange points, data centers and submarine cables, which makes them the most connected country in the world. The visualization was produced using a quantitative approach for analyzing the data.
